Schedule saturation: why a full agenda and a profitable practice are not the same thing
A chair sitting empty for 30% of available hours is a fixed cost generating zero revenue. But a chair that runs at 85% occupancy filled with short low-value appointments can produce the same financial result.
Saturation measures how much of your available capacity is working. The useful question is whether what fills the chair covers its cost and leaves margin. That requires connecting occupancy with euros per hour, not just appointment count.
What is saturation
Schedule saturation measures how much of the available chair time is actually used for productive appointments. It is different from having a busy agenda: cancellations, short visits and low-value treatments can fill the day without covering the real cost of the chair.
The basic formula is: chair saturation % = completed productive hours / available clinical hours x 100. If a chair is available 160 hours per month and completed treatments occupy 118 hours, saturation is 73.8%. Booked hours can be tracked separately, but completed productive hours are the number that matters financially.
How to calculate it
Start with the total available clinical hours for each chair, then compare them with booked and completed production hours. The most useful view separates hygiene, conservative dentistry, prosthetics, surgery and orthodontics because each area has a different margin profile.
For example, two chairs may both be 80% occupied. One is filled with high-value restorative and prosthetic work; the other is filled with short appointments, emergencies and low-margin treatments. The same saturation percentage creates very different economics. That is why saturation should be read with production per chair and treatment mix.
Use the same calendar rules every month. Define what counts as available time, what counts as productive time and how to treat cancellations, blocked time, training and emergency slots. Without stable rules, saturation moves because the measurement changes, not because the practice improved.
Ideal benchmark
A healthy benchmark depends on the practice model, number of clinicians and treatment mix. The goal is not 100% occupancy at any cost, but a balanced agenda where enough high-value work is scheduled to cover fixed costs and produce margin.
Very low saturation usually means capacity is unused: recall is weak, case acceptance is low, or marketing is not generating the right demand. Very high saturation can also be a problem if it creates delays, no room for emergencies, stressed clinicians and a worse patient experience. A healthy target often sits below maximum capacity but above the break-even level of the chair.
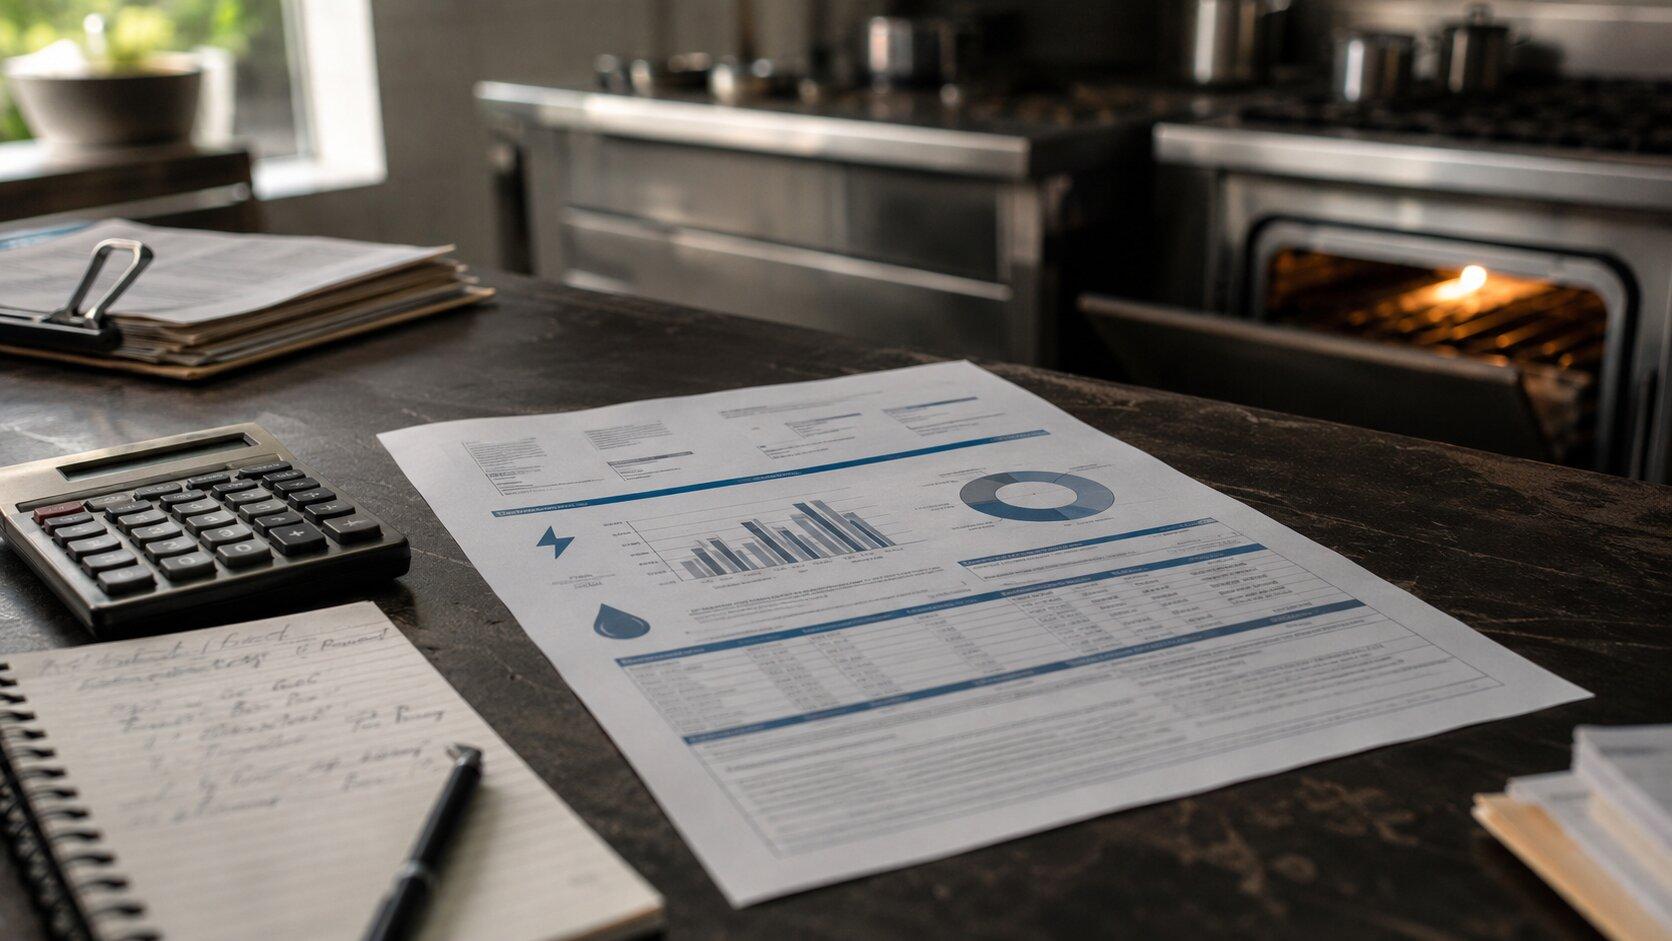
Use a simple scenario. If a chair costs EUR70 per available hour and produces EUR95 per hour, it is covering its base but leaving limited room for overhead and profit. If the same chair produces EUR180 per hour with a healthier treatment mix, the practice can absorb cancellations and still protect margin. Saturation only becomes useful when it is connected to euros per hour.
What to do if it's too low or too high
If saturation is low, review recall, treatment plan follow-up and chair allocation. If it is too high, the practice may be creating delays, staff pressure and lower patient experience. In both cases, the indicator should be read together with production per chair and profit per hour.
Common mistakes include measuring only booked hours, ignoring no-shows, mixing hygiene with complex treatments and failing to separate doctor time from chair availability. Another mistake is pushing occupancy without protecting the schedule for high-value treatments. A full agenda with the wrong mix can still be economically weak.
The monthly action should be specific. If hygiene saturation is low, work on recall and reactivation. If surgery is blocked by lack of long appointments, redesign the agenda. If no-shows are concentrated in first visits, review confirmation and financing follow-up. The KPI is useful only when it points to a change in the calendar.
To get started: calculate available hours by chair, separate booked and completed hours, classify appointments by treatment type, review cancellations, track production per hour and compare the result with dental chair hourly cost. EUSTAK helps by connecting cost data with production, so the practice can see whether chair time is truly profitable.
Balanced scheduling: booking ahead without locking the practice solid
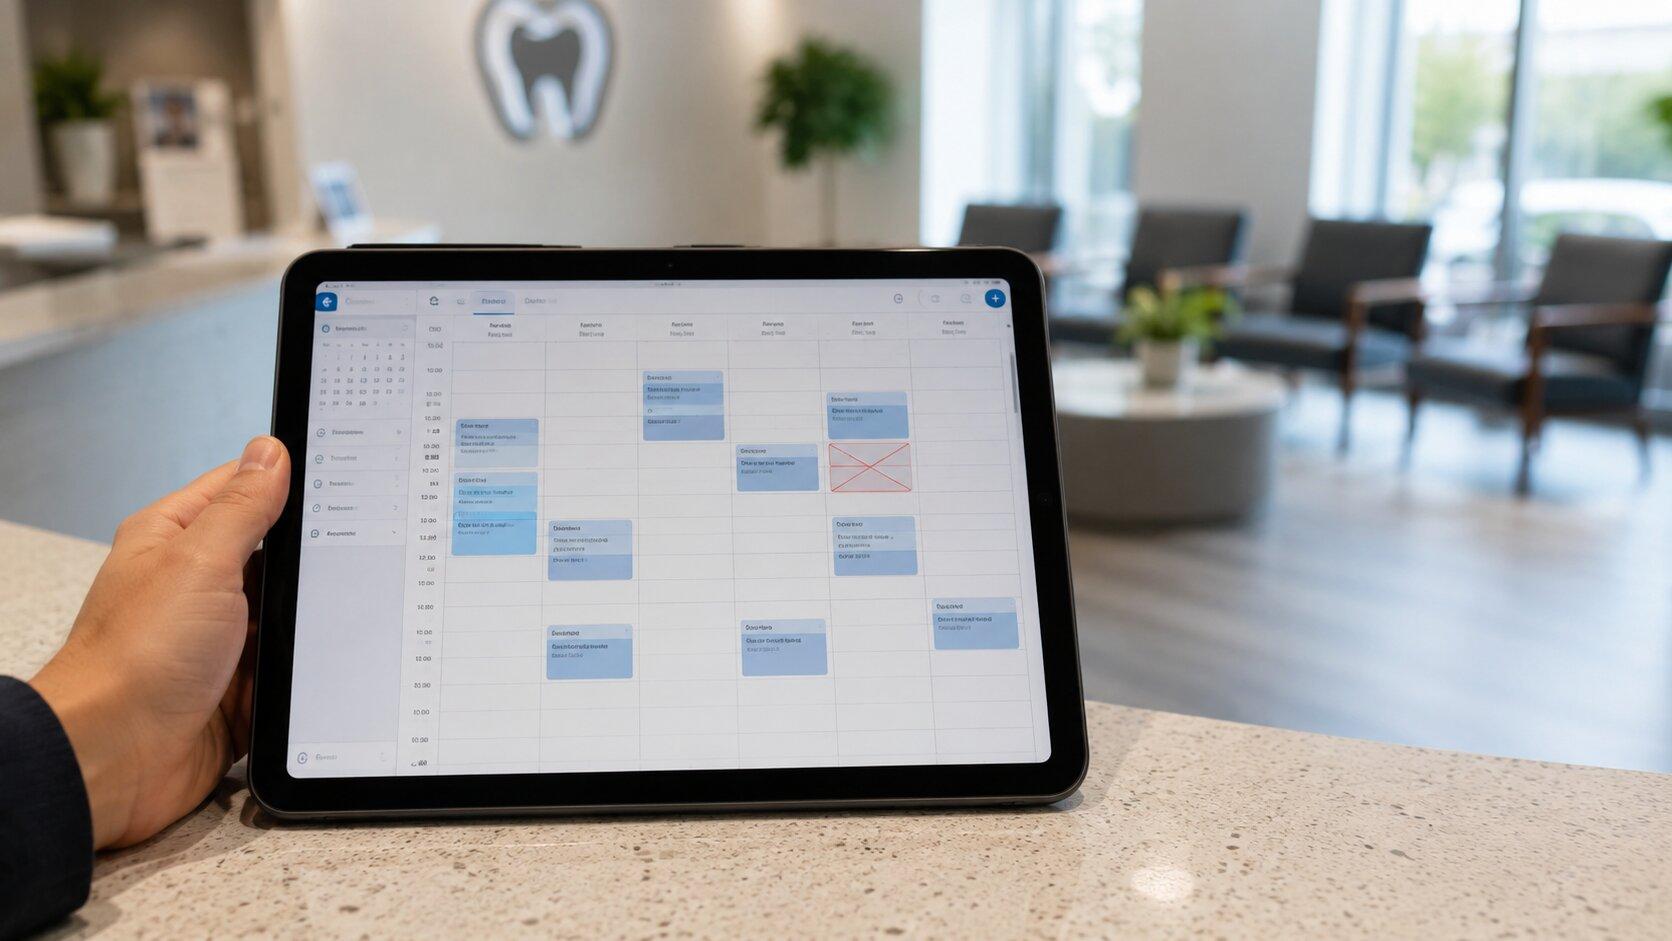
Optimal saturation is not only about how many hours you fill, but how you fill them. A balanced schedule books recall visits, check-ups and treatment follow-ups 2-3 months ahead for every active patient, not just the current week.
The opposite failure to low saturation is a schedule locked solid: booking so far ahead, with no margin left, that there is no room for emergencies or new patients calling today. A fully locked schedule looks healthy on paper, with high saturation, but it blocks growth, since every new patient who cannot get an appointment within 1-2 weeks looks elsewhere.
The practical fix is reserving a fixed share of slots, roughly 10-15% of weekly capacity, for emergencies and new patients, planned as its own category rather than left to chance. In practices with more than two chairs, it also helps to assign one person responsible for booking rules (owner, practice manager or head receptionist): without a clear owner, every team member manages the schedule their own way and saturation becomes impossible to read consistently.
Frequently asked questions
Is 100% schedule saturation a good target to aim for?+
How should I count no-shows when calculating saturation?+
Can a dental chair be saturated but still unprofitable?+
How many slots should I reserve for emergencies and new patients?+
Find out whether your busiest chair is actually your most profitable one
EUSTAK aggregates fixed costs per chair from invoices so you can compare chair saturation against real euros generated per hour.
See my chair profitability