Revenue vs Profit: Your Business Can Have a Record Year and Still Be Broke

Two restaurants on the same street, both billing EUR80,000 a month. One owner takes home EUR6,000. The other is behind on rent. Revenue tells you how much came in — it says nothing about what stayed.
Between your top line and actual profit sit direct costs, payroll, rent, software, financing, and taxes. Each layer takes a cut. The gap is almost always larger than owners expect until they map it out.
Revenue and Profit: Two Completely Different Numbers
Revenue (or turnover) is the total income generated by your business before any costs are deducted. Net profit, on the other hand, is what remains after subtracting all costs — including depreciation, provisions, financial charges, and taxes.[Investopedia]
The gap between these two numbers can be enormous. A restaurant generating £800,000 a year but spending £790,000 on staff, ingredients, rent, and utilities is technically "doing great volume" — but barely earning anything. Yet that £800k figure sounds like a success story.
In the example, both restaurants earn the same revenue (£500k), but Restaurant A (managed with real controls) reaches £200k gross margin, £80k operating margin and £35k net profit, against £130k, £20k and £5k for Restaurant B (unmonitored management).
The Margin Cascade: Where Money Disappears
To understand where revenue goes, you need to follow the chain of intermediate margins.
Gross Profit Margin
The first test: how much of your revenue survives after paying direct production costs (ingredients, cost of goods sold)? A low gross margin means there's little room to manoeuvre for everything else.
EBITDA
EBITDA measures operating profit before interest, taxes, depreciation, and amortisation. It's the most useful indicator of core business profitability — stripping out financing decisions and accounting choices to show what the business actually generates.[Wall Street Prep]
EBIT (Operating Profit)
EBIT adds depreciation back in — showing the true cost of using assets over time. It's the profit from operations before financing costs and taxes.
Net Profit
The formula: Net Profit = Total Revenue – (Operating Costs + Depreciation + Provisions + Finance Charges + Taxes). Four successive filters. At each stage, a portion of revenue disappears.
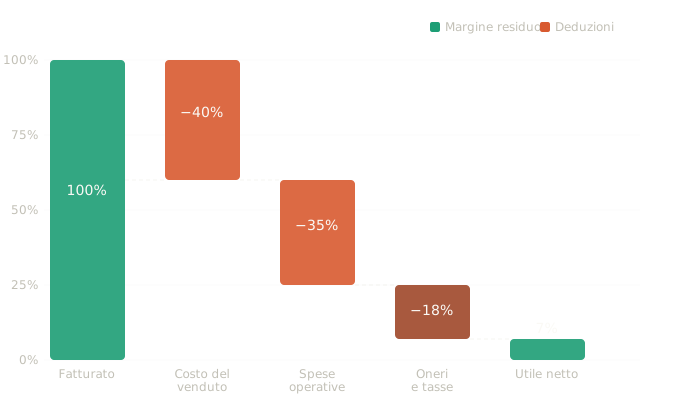
From revenue to net profit: each step reduces available margin
The Five Silent Profit Killers
Margins too thin on your product or service
If your selling price doesn't adequately cover direct costs, you're working hard for very little. In hospitality, an incorrect food cost percentage turns every dish into a hidden loss.
Fixed cost structure too heavy
Rent, permanent staff, software, energy — these costs exist regardless of how much you sell. A structure oversized for your actual volume is one of the most common causes of illusory profitability.
Growth that never reaches break-even
Selling more isn't enough if the increase doesn't exceed fixed costs. Every sale must first cover variable costs, then contribute to covering fixed costs — and only after that point does real profit begin.
Growth itself consumes cash
More volume means more stock, more staff, more supplier advances, more working capital. If you run short of liquidity because working capital is exhausted, you risk not being able to pay suppliers or staff.
Profit and cash are not the same thing
Cash flow should not be confused with profit. Even profitable businesses can become insolvent if cash flow is interrupted — a lesson many fast-growing businesses learn the hard way.
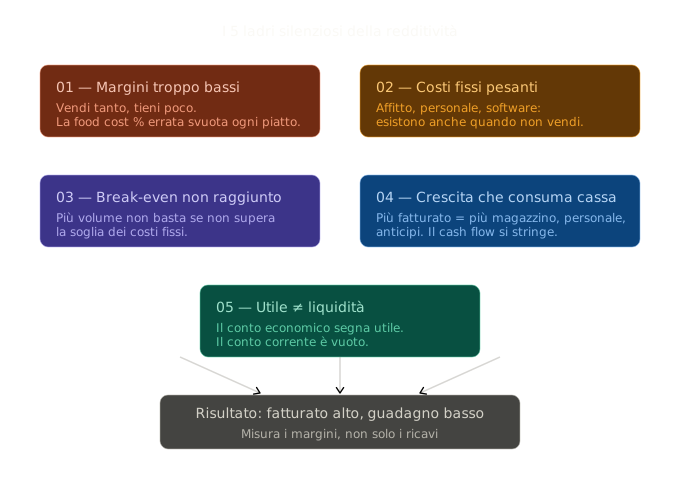
Five factors that erode margins even when revenue is growing
Your Biggest Client or Product Isn't Always Your Most Profitable One
A common mistake is assuming the client or product generating the most revenue is also the most profitable. It isn't necessarily: a large client can demand volume discounts, more frequent deliveries, customisation and management time that revenue alone doesn't capture. Margin per client or product matters more than the revenue it generates: it sometimes reveals that your "most important" client is actually the one weighing you down without returning proportionally.
The check is simple: take your top five to ten clients or products by revenue and calculate the real margin on each (revenue minus direct costs and its share of overhead). It's not unusual to find that your second or third client by revenue is actually your first by margin, and that your "number one" client by revenue is propping up the business without making it any richer.
Cash Flow: You Can Be Profitable and Still Run Out of Money
One of the most common mistakes among business owners is confusing cash flow with profit. A business can be technically profitable, but if customers pay late or expenses are poorly timed, liquidity may not be sufficient.[ACCA]
The mechanism is simple: you issue an invoice today, but payment arrives in 60 or 90 days. Meanwhile, payroll and suppliers won't wait. The P&L shows a profit — but the bank account is under pressure.
For restaurants and B2C businesses this is less common (most sales are settled immediately) — but it still appears in the form of seasonal cycles, supplier spend spikes, equipment renewals, and extraordinary costs that all arrive at once.
This is why management should read the profit and loss statement together with the bank movement. If sales are growing but suppliers are paid faster than customers, the business may need more working capital. If sales are stable but cash is falling, the issue may be inventory, debt repayments or tax timing rather than the commercial model itself.
What to Actually Track to Measure Business Health
Not raw revenue. These are the numbers that matter:
- ·Gross margin % — how much survives after direct costs
- ·EBITDA margin — real operating profitability, sector by sector
- ·Net profit % — what actually stays in your pocket after everything
- ·Operating cash flow — real liquidity generated by the business
- ·Food cost % / Cost ratio — for hospitality, precise cost control by category
A practical monthly review starts with three checks: margin by category, fixed cost coverage and cash forecast. If gross margin is weak, focus on prices, purchasing and waste. If EBITDA is weak, review payroll and structure. If cash is weak while profit looks fine, review collection timing and supplier terms. For the liquidity side, connect this analysis with cash flow versus profit.
Conclusion: Revenue Is Vanity, Margin Is Sanity
The revenue myth persists because it's the most visible, simplest number to share. But two businesses with identical revenue can be in completely opposite positions — one solid, one on the edge of collapse. Everything depends on margins, cost structure, collection timing, and liquidity management.
Gross margin, EBITDA, net margin, and cash flow are each measuring something distinct. Tracking them together, monthly, is what turns revenue data into a usable picture of business health.
Frequently asked questions
Why does a business with strong revenue still struggle to pay bills?+
What is a realistic net profit margin for a small restaurant or bar?+
How do I know if my pricing is the problem or my cost structure is?+
Is the client or product that generates the most revenue always the most profitable?+
Getting from revenue to margin takes real costs: start with your restaurant's food cost.
Your gross margin and net margin, updated from invoices every month
EUSTAK reads your supplier invoices, classifies direct costs and fixed costs separately, and shows you where margin disappears — before the year-end accounts arrive.
Calculate my margin